
As a startup you will be in an advantageous position by having the capabilities to gather and understand data to drive your decisions. Data will provide you insights into different parts of your business from sales, operations, marketing, to human resources. Ultimately making decisions based on data will save you money, increase your productivity, increase revenue, personalize customer experience and more. At the early stages of your company, you will have small amounts of data but having the systems in place from early on will allow you to leverage historical data traced back to the beginning of your business and have a data driven company from day one.
Data provides visibility into historical and real time performance of different areas of the company. For instance, as a company you can make decisions related to sales by understanding historical trends and relevant information associated with different points in time (e.g. marketing promotions, seasonality, etc.). In addition, using data allows companies to be more cash efficient by understanding and improving their economic measurements (e.g. cost drivers, price fluctuations, etc.) which in result provides better returns for the company and investors.
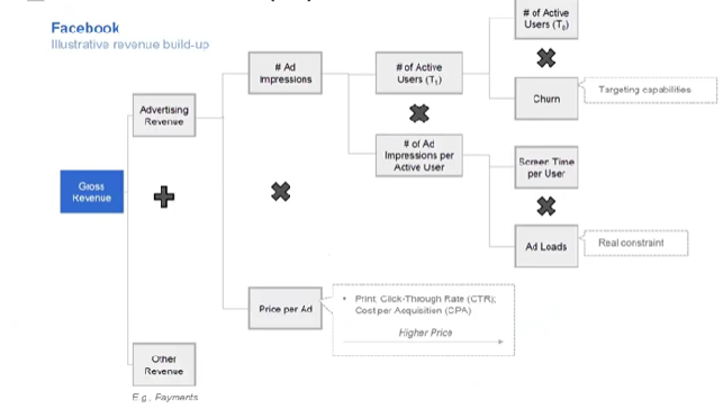
KPI Trees
The data that you should use to make decisions depends on the goals your company is aiming for. To know the type of data you need to collect and analyze, you can build KPI Trees for every business objective that you have. A KPI Tree is as a tool in which business objectives are subdivided into more detailed components so you can track everything that affects this main business objective and understand any relationships. Carlos Medeiros, partner at SoftBank, provided the KPI tree example below using Facebook as a use case. In this example, we are considering “Growing Revenue” as one of their business objectives and using it to create a KPI tree. In this case, Facebook’s revenue can come from ads or other sources such as in-app payments. If we focus on advertising as a source of revenue, it would be subdivided by the metrics “Number of ad impressions” and “Price per ad” and each of those sub-KPIs will be subdivided into its components as seen on the illustration below. KPI trees allow you to graphically see the cause and effect of any decision you were to make. In this use case for Facebook, you understand not only the metrics that can be influenced to increase revenue but also the trade-offs associated with those changes (e.g. if they increase the number of ad impressions, users can start decreasing their screen time). As a startup, you need to create KPI trees for each of your objectives to understand early on the type of data you must collect and be aware of interdependencies that will affect any decisions you make.
Steps to Create a KPI Tree:
- Define your business objectives (e.g. increase profit)
- Determine the main KPI that best aligns with each objective (e.g. total profit)
- Subdivide the main KPI into the metrics that drive this KPI to fluctuate (e.g. revenue minus costs)
- Subdivide all of the metrics into their components (e.g. costs can be subdivided into variable and fixed costs for instance)
Making Marketing Decisions Using Data
As mentioned previously, the use of data depends on your goal. When it comes to marketing, data can be used to make better decision throughout the marketing funnel: awareness, evaluation, purchase, and delight. Most companies focus their efforts on the purchase phase to acquire and retain customers. However, Alexandra Zatarain, VP of Marketing at Eight Sleep, argues that data is most useful to build brand awareness.
Data can’t help you determine what your company stands for or what's its DNA. Rather, companies need to identify the core pillars of their brand without the use of data. To do so, Mrs. Zatarain recommends using the concepts described in the book “Get to Aha!” by Andy Cunningham. After the company’s pillars are defined, then data can help answer questions such as what’s the audience interested in your company’s pillars and mission? What messaging resonates with them? What channels should be used to reach them? and so on. The data to inform those questions can be gathered using multiple tools such as surveys, focus groups, sales data, etc.
As a startup, you should start running surveys yourself as early as possible in the life of your company to track your brand’s awareness and sentiment. A “Brand Tracker Survey” is one of the tools Eight Sleep uses to keep track of their brand. The survey should be structured to be statistically relevant (e.g. number of people surveyed, demographics, etc.) and it needs to include customers as well as non-customers to get insights into future potential targets. This survey is divided into different sections: demographics, attitudes, behaviors, brand awareness and brand attributes. Below are some important details for each of these sections:
- Demographics: include age, income, area of residence, ethnicity, marital status, education and any other relevant demographic to the nature of your business.
- Attitudes: include questions to measure subjective things such as opinions, emotions, perceptions, and judgments that are relevant to your business. Remember to use a rating scale. (Example question for a restaurant business: rate this statement from a scale to strongly agree to strongly disagree - “eating out is an essential part of my social life”)
- Behaviors: include questions to measure respondent’s actual behaviors that are relevant to your business (Example question for a restaurant business: answer yes or no - “I eat out at least once a week”)
- Brand Awareness: include questions that can measure how aware people are of your brand. One of the most important questions to ask your respondents is “What brands do you associate with the <your brand’s category (e.g. sleep fitness)> category?”. Then you can analyze where you stand against competitors based on the percentage of people that listed your brand first vs another brand. Brand awareness needs to be tracked over time and it should be increasing if you’re spending your marketing budget correctly.
- Brand Attributes: include questions that measure what people think about your main brand attributes (e.g. quality) and how it compares to other brands in your category. This can be measured by asking your respondents to rank different brands for each attribute you want to measure. (Example question for a restaurant business: please rank the following restaurants based on your opinion of this statement “Offers high quality food”)
Analyzing responses from the Brand Tracking Survey allows you to understand how customers feel and think about the brand, understand how customer behave and their preference, etc. All this information can be used to make informed decisions about your marketing efforts (e.g. targeting, messaging, ads). Using the restaurant example, if you see that the younger the demographic the more likely someone knows about your restaurant, then you can decide to strengthen your targeting to the younger demographic and build loyalty or perhaps shift your marketing to also target an older demographic. This is just a simple example, and your decisions will depend on your strategy and business goals. A Brand Tracker Survey should be conducted at least once a year to see how decisions you’ve made have affected people’s perception and awareness of your brand.
When making decisions in your business, data can only take you so far. When thinking of what decisions to make, it becomes important to consider one of Jeff Bezos’ most famous quotes with regards to his starting of Amazon, “Make decisions with 70% of the information that you wish you had.” For this to be increasingly effective it is necessary to evaluate the efficacy of the data that was used in previous decision making and to refine the process continuously. Especially in the world of marketing, where tastes and customer preferences change so rapidly, the ability to pinpoint where to spend the advertising budget is invaluable, but only if used with the proper resources to make it effective. Data can guide you towards answering parts of your questions and hypotheses, but your intuition and creativity will take you to the last mile.
This post was written by Dalia Benchimol and Jeffrey Camp. Mrs. Benchimol is a member of Cane Angel Network investment team and is pursuing her MBA from the University of Miami graduating in 2023. Mr. Camp is the Managing Director of the Cane Angel Network.

